वापस जायें / Back
Economic Planning in India
History
- M. Vishveshwarya published a 10 years plan for India in his book “Planned Economy for India” in 1934.
- Indian National Congress formed the National Planning Committee in 1936 for finding our possibilities for making a National Plan for the whole country.
- Eight Industrialists of Mumbai presented a 15 years plan in 1944 called – “A plan for Economic Development for India”. This plan was made by Tata, Birla etc.
- Shriman Narayan Agreawa presented a “Gandhian Plan” in 1944.
- M N Roy presented the “People’s Plan in 1944.
- Jaiprakash Narayan formulated the “Sarvodaya Plan” in 1950.
Main features of economic planning in India
- Planning in India is mostly centralized.
- The implementation of the plan is done in a decentralized manner.
- Both capitalist and socialist features co-exist in India. India has a mixed economy.
- Plans in India have multiple objectives and emphasize social justice with economic growth.
Objectives of Planning in India
- Growth – This means increase in production of goods and services resulting in increase in National and per capita income.
- Modernization – Use of modern technology and change in social attitudes.
- Self sufficiency – In food productions and other necessities.
- Equality – of income and reduction in inequalities of wealth and establishment of a socialist society.
Planning Commission
- The Planning Commission was set up in March 1950.
- The Planning Commission was charged with the responsibility of formulating plans for the most effective and balanced utilization of resources and determining priorities.
- Five year plans made by the planning Commission were approved by the National Development Council.
- National Development Council is the Highest body for deliberations and decisions on development matters and is headed by the Prime Minister. Members of the Union cabinet, Chief Ministers of Sates, representatives of Union Territories and members of Niti Aayog are its members. It was constituted on 6th August 1952. It is a non-statutory body contituted by an order of the Government.
Five Year Plans
- First Plan (1951 – 56) growth target -2.9% achievement - 3.6%
- This plan was based on the Harrod-Domar model
- The plan addressed mainly agrarian sector, power and irrigation.
- Community Development programme started in 1952.
- Many irrigation projects were initiated during this period, including the Bhakra Dam and Hirakud Dam.
- Second Plan (1956 – 61) growth target 4.5% achievement 4.3%
- Focused on industry, especially heavy industry
- Development of public sector
- It followed the Mahalanobis model
- Third Plan (1961 – 66) growth target 5.6% achievement 2.8%
- Stressed on agriculture and improvement in the production of wheat resulting in self sufficiency in food production.
- Sino-Indian War of 1962 exposed weaknesses in the economy and shifted the focus towards the Defense industry
- Many primary schools were opened in rural areas.
- Plan Holiday (1966-69)
- In 1965–1966, India fought a War with Pakistan
- There was a severe drought in 1965
- The war led to inflation and the priority was shifted to price stabilization
- The construction of dams continued.
- Green revolution was started in 1966-67.
- Fourth Plan (1969 – 1974) growth target 5.7% achievement 3.3%
- Based on Allen Manney and Ashok Rudra model
- Bank Nationalization in 1969 (14 Banks)
- Main emphasis was on growth with stability
- Influx of Bangladeshi refugees before and after 1971Indo-Pak war was an important issue.
- Fifth Plan (1974 – 79) growth target 4.4% achievement 4.8%
- Prepared and launched by D.D. Dhar
- Two main objectives:– removal of poverty (Garibi Hatao) and– attainment of self reliance
- Promotion of high rate of growth, better distribution of income and significant growth in the domestic rate of savings were seen as key instruments
- The plan was terminated in 1978 (instead of 1979) when Janta Party Government came to power
- Rolling Plan (1978 - 80) – This was done by Janta Government which lasted for only 2 years.
- Sixth Plan (1980 – 85) growth target 5.2% achievement 6.0%
- Focus on Increase in national income, modernization of technology, continuous decrease in poverty and unemployment, population control through family planning, etc.
- Seventh Plan (1985 – 90) growth target 5.0% achievement 6.0%
- Focus on rapid growth in food grains production, increased employment opportunities and productivity
- Eighth Plan (1992 – 97) growth target 5.6% achievement 6.8%
- The eighth plan was postponed by two years because of political uncertainty at the Centre, Worsening Balance of Payment position and inflation
- Two annual plans were implemented from during 1990-92.
- Based on John W Miller’s Liberalized economic model.
- Drastic policy measures to combat the bad economic situation
- Some of the main economic outcomes during eighth plan period were rapid economic growth, high growth of agriculture and allied sector, and manufacturing sector, growth in exports and imports, improvement in trade and current account deficit.
- Ninth Plan (1997 – 2002) ) growth target 6.5% achievement 5.4%
- It was developed in the context of four important dimensions:– Quality of life, Generation of productive employment, Regional balance and Self-reliance
- Provide for the basic infrastructural facilities like education for all, safe drinking water, primary health care, transport and energy.
- Check population increase
- Social issues like women empowerment, Benefits for the Special Groups of the society
- Create a liberal market for increase in private investments
- Tenth Plan (2002 – 2007) growth target 8.0% achievement -7.8%
- Reduction in gender gaps in literacy and wage rates by at least 50% by 2007.
- Create 70 million new work opportunities and reduce educated unemployment to below 5%.
- Raise real wage rate of unskilled workers by 20 percent
- Reduce dropout rates of children from elementary school from 52.2% in 2003-04 to 20% by 2011-12
- Increase literacy rate for persons of age 7 years or above to 85%.
- Raise the sex ratio for age group 0-6 to 935 by 2011-12 and to 950 by 2016-17.
- Ensure that at least 33 per cent of the direct and indirect beneficiaries of all government schemes are women and girl children
- Connect every village by telephone by November 2007 and provide broadband connectivity to all villages by 2012
- Increase forest and tree cover by 5 percentage points
- Eleventh Plan (2007 – 2012) growth target Initially 9% later reduced to 8.1% achievement – 7.9%
- Faster and inclusive growth
- Twelfth Plan (2012-2017) growth target 8%
- Fast, sustainable and more inclusive growth.
- Emphasis on health, education, skill development, environment, natural resources and infrastructure.
NITI Aayog
The National Institution for Transforming India, also called NITI Aayog, was formed via a resolution of the Union Cabinet on January 1, 2015. NITI Aayog is the premier policy ‘Think Tank’ of the Government of India, providing both directional and policy inputs. While designing strategic and long term policies and programmes for the Government of India, NITI Aayog also provides relevant technical advice to the Centre and States.
The Government of India, in keeping with its reform agenda, constituted the NITI Aayog to replace the Planning Commission instituted in 1950. This was done in order to better serve the needs and aspirations of the people of India. An important evolutionary change from the past, NITI Aayog acts as the quintessential platform of the Government of India to bring States to act together in national interest, and thereby fosters Cooperative Federalism.
Important Indicators of National Income
Gross domestic product (GDP) is the monetary value of all the finished goods and services produced within a country's borders in a specific time period. It includes income earned by foreigners within the country but does not include income from foreign investments.
Net Domestic product (NDP) is Gross Domestic Product minus the depreciation on a country’s capital goods.
Gross National Product (GNP) is the total value of goods produced and services provided by a country during one year. It is equal to the gross domestic product plus the net income from foreign investments but does not include income of foreigners residing in the country.
Net National Product (NNP) is Gross National Product minus the depreciation on a country’s capital goods.
National Income – When Net National Product is calculated at factor cost, it is also called National Income. However if it is calculated at Market prices then National Income is arrived at by subtracting indirect taxes and adding subsidies to Net National Product.
Per-capita Income – It is calculated by dividing Net National Product by total population.
Real National Income – National Income is calculated – at current prices and at constant prices. When National Income is calculated at constant prices for a specific year, it is called real National Income
Purchase Power Parity – The method of finding out the price to be paid for purchasing a common basket of goods and services in one country with price to be paid in another country in its currency is called purchase power parity.
Methods of measuring National Income
- Product Method: In this method, national income is measured as a flow of goods and services. We calculate money value of all final goods and services produced in an economy during a year. Final goods here refer to those goods which are directly consumed and not used in further production process.
- Income Method: Under this method, national income is measured as a flow of factor incomes. There are generally four factors of production labor, capital, land and entrepreneurship. Labor gets wages and salaries, capital gets interest, land gets rent and entrepreneurship gets profit as their remuneration
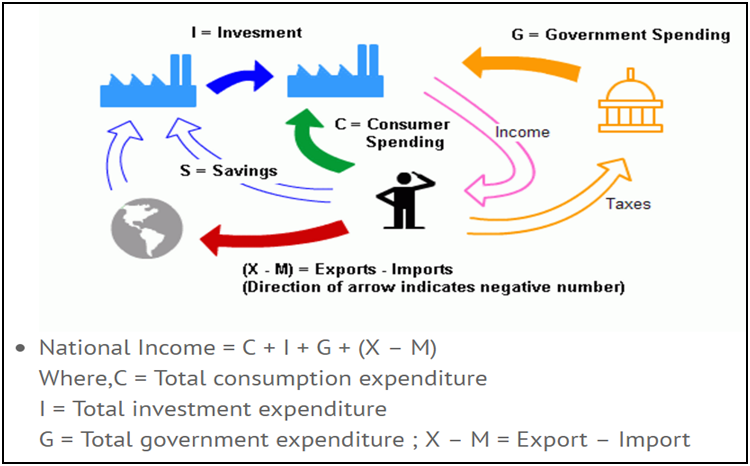
- Expenditure Method: In this method, national income is measured as a flow of expenditure. GDP is sum-total of private consumption expenditure. Government consumption expenditure, gross capital formation (Government and private) and net exports (Export-Import).
Measurement of National Income in India
Dadabhai Nauroji had written in his book “Poverty and Un-British rule in India” that per capita income of India was Rs 20/-.
After independence National income committee was constituted under P.C. Mahalanobis.
Central Statistical Organization (CSO)
Measurement of National Income is done by CSO. It had made the first official estimates of National Income in 1956. At present the base year for National Accounts is 2011-12. The economy is divided into the following sectors for measurement of National Income-
- Primary Sector – Agriculture, Forestry, Fisheries, Mining
li>Secondary Sector – Manufacturing, production of goods, electricity, gas and water
- Tertiary Sector – Transport, Warehousing, Communication, Trade, Restaurants, Banking and Insurance, Real estate, public administration, other services, foreign sector
Recent changes in National Accounts by the CSO –
Development will now be measured at constant prices as is done Internationally. Earlier it used to be measured at factor cost. Secondly the measurement of Gross value added (GVA) will be at basic prices instead of at factor cost. The base year was also changed from 2004-05 to 2011-12.
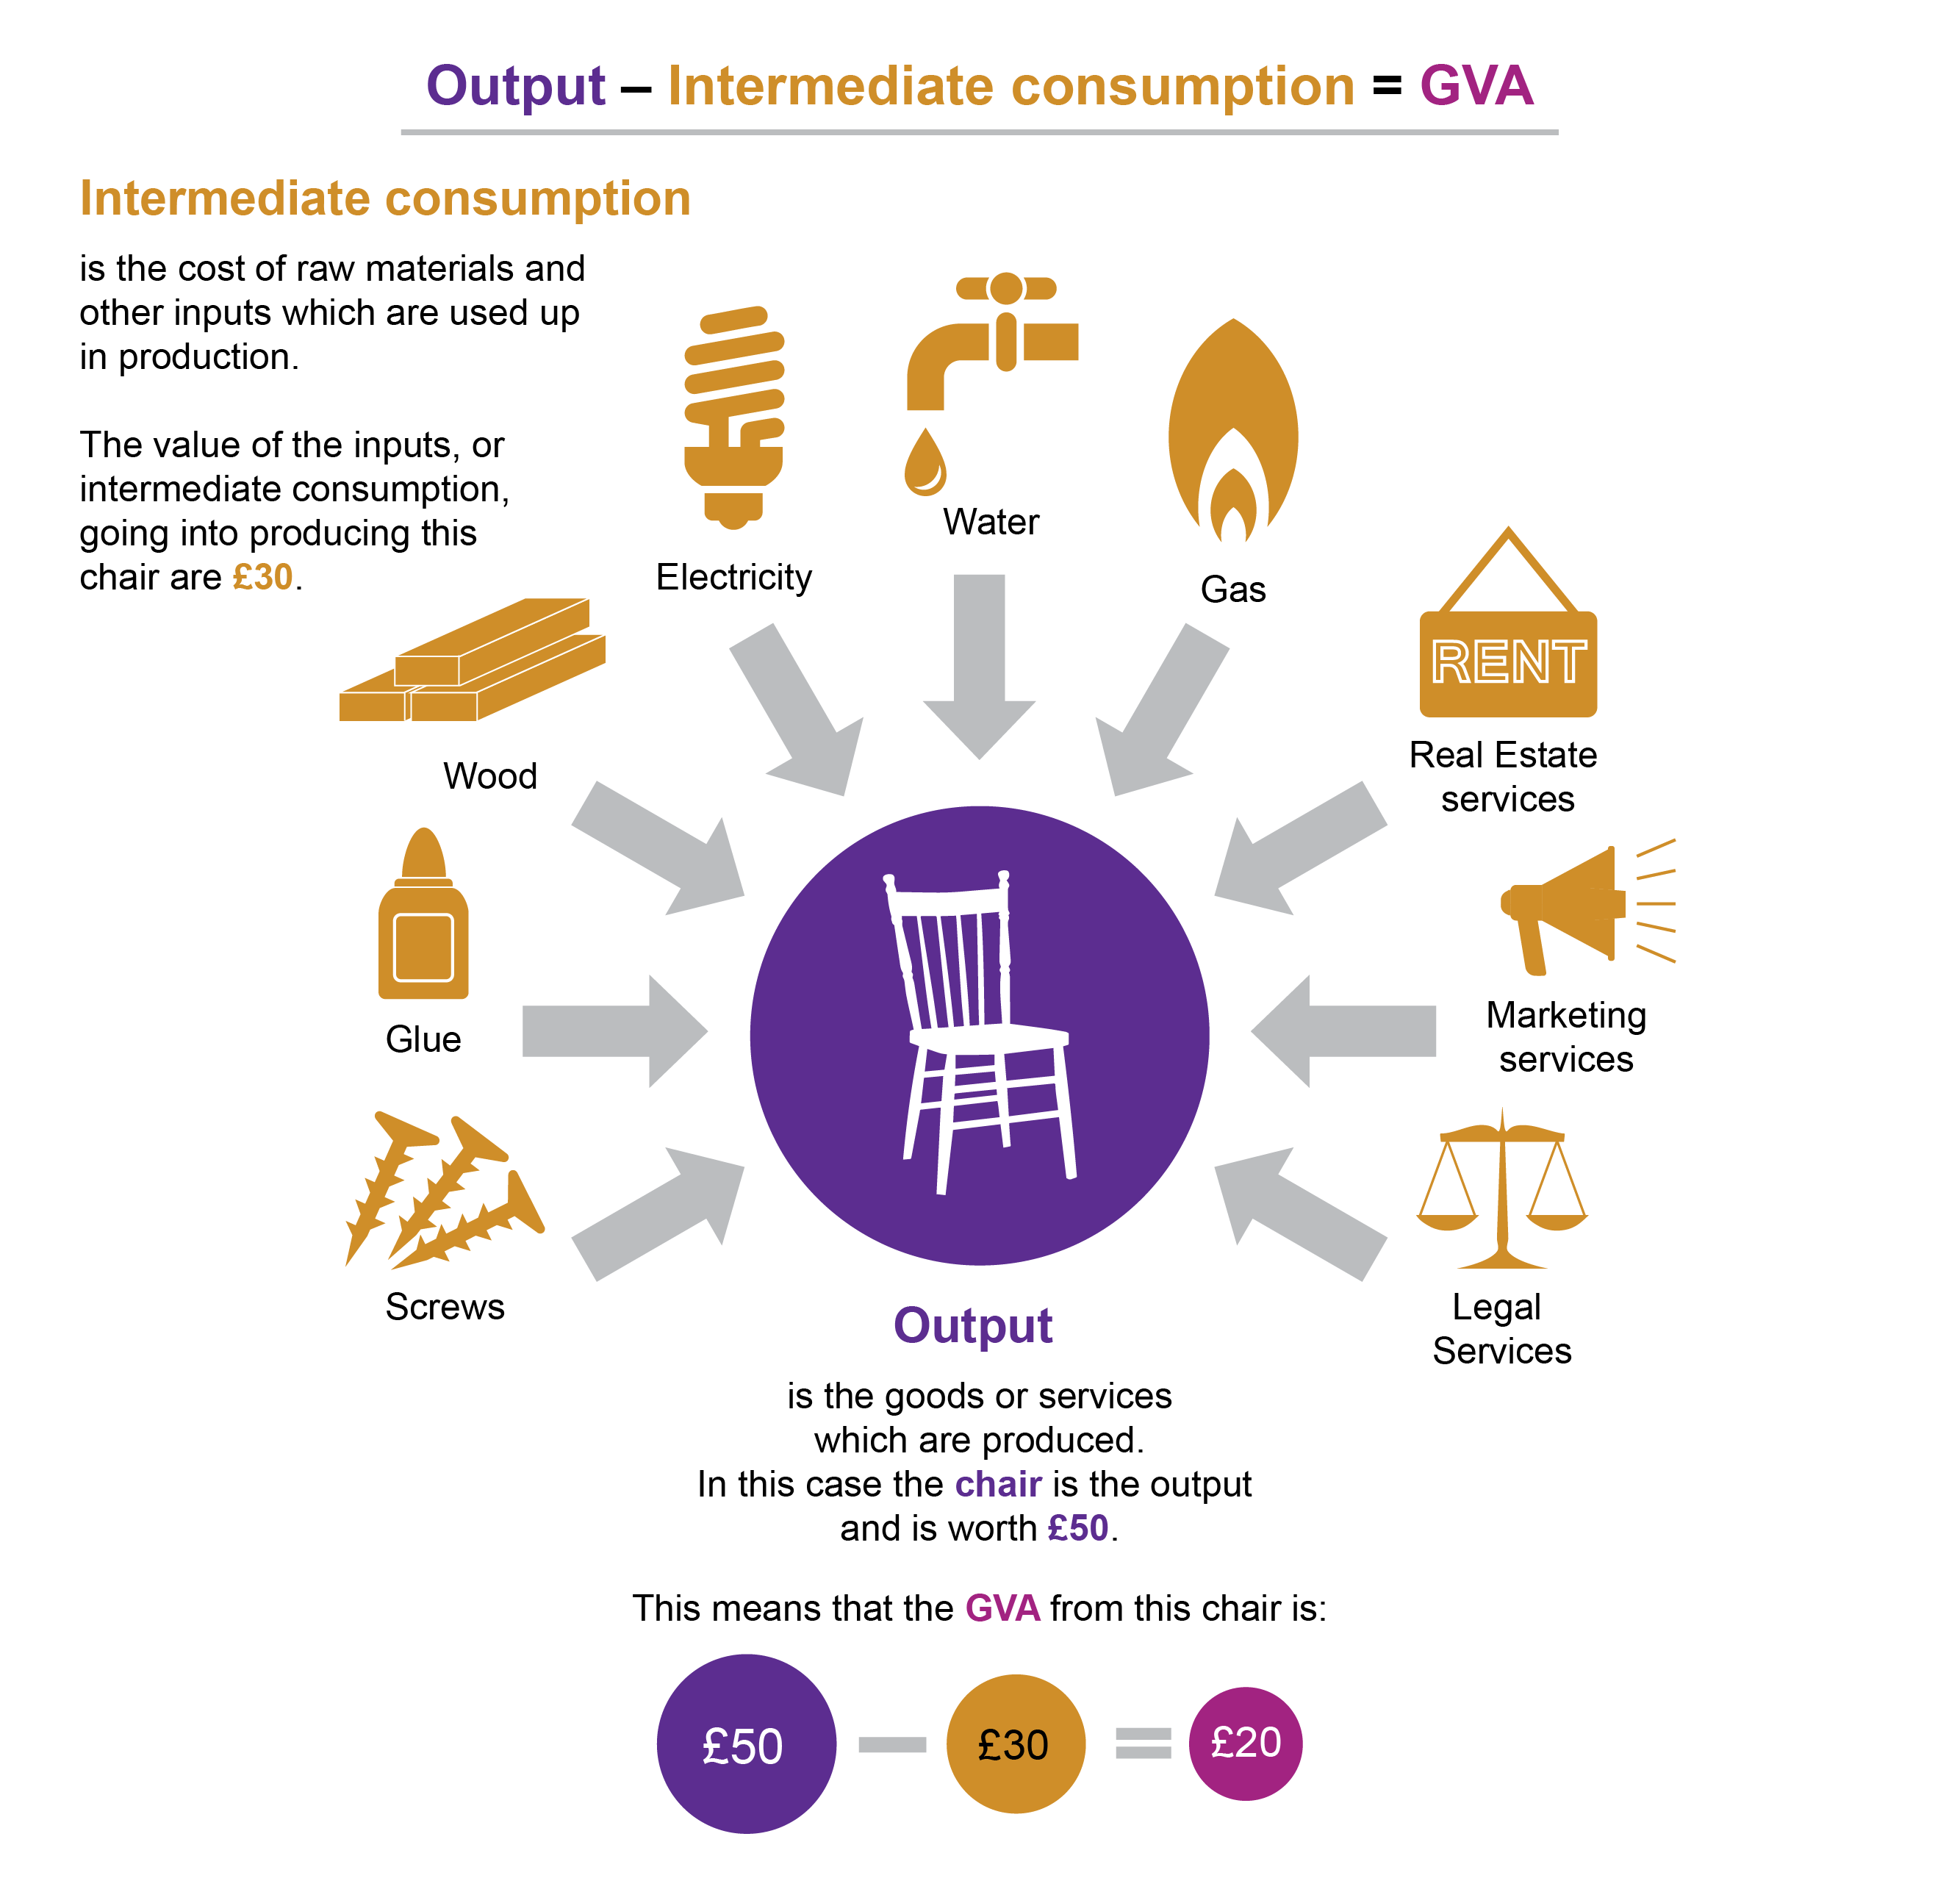
Gross value added is a productivity metric that measures the contribution to an economy, producer, sector or region. Gross value added provides a dollar value for the amount of goods and services that have been produced, less the cost of all inputs and raw materials that are directly attributable to that production.
Relationship between GVA at basic prices, GVA at factor cost and GDP –
GVA at factor cost + (Production taxes less Production subsidies) = GVA at basic prices
GDP at market prices = GVA at basic prices + Product taxes- Product subsidies
Sector-wise contribution in GVA (as per 2011-12 series)
| Sector | 2013-14 | 2014-15 |
| Agriculture and related | 18.6 | 17.6 |
| Industry | 30.5 | 29.7 |
| Services | 50.9 | 52.7 |